
Plugin, woo commerce
Compare
Advanced WooCommerce Reporting
- Free & Original product!
- You will be given files that remain unaltered and unedited
- 100% Clean Files & Free From Virus
- Unlimited Domain Usage
- Free New Version
- Product Version : 5.9
- Product Last Updated : 21.06.2021
- License : GPL
$0.00
Features:
- Sales Overview: Get a comprehensive view of your store’s sales performance, including total sales, average order value, and the number of orders over a specific time period.
- Product Sales Report: View detailed reports on individual product sales, including top-selling products, low-performing products, and stock levels.
- Category Sales Report: Analyze sales by product categories, helping you identify which product categories are performing well and which ones may need attention.
- Customer Insights: Understand your customer base with reports on customer demographics, purchase history, and lifetime value. This can help with targeted marketing efforts.
- Revenue and Profit Analysis: Track revenue and profit margins to gauge the financial health of your store. You can break down profits by products, categories, or time periods.
- Order Analysis: Analyze order data to identify trends, such as the most popular payment methods, shipping methods, and order status breakdowns.
- Coupon and Discount Analysis: Evaluate the effectiveness of your discount and coupon campaigns by tracking usage and their impact on sales.
- Abandoned Cart Reports: Identify and recover potentially lost sales by tracking abandoned carts and understanding the reasons behind cart abandonment.
- Inventory Management: Keep track of your inventory levels and receive notifications when products are running low or out of stock.
- Customizable Dashboards: Create custom dashboards with widgets to display the most relevant data for your business. This allows you to focus on key metrics.
- Export and Sharing: Export reports in various formats (CSV, PDF, etc.) for further analysis or sharing with team members and stakeholders.
- Multi-store Support: If you have multiple WooCommerce stores, some reporting tools may offer consolidated reports, making it easier to manage and analyze data across all your stores.
- Scheduled Reports: Set up automated report scheduling, so you receive important sales and performance data at regular intervals.
- Visual Charts and Graphs: Present data visually through charts, graphs, and tables to make it easier to interpret and make informed decisions.
- Filters and Segmentation: Apply filters to segment data based on criteria like date ranges, product attributes, and customer characteristics for more in-depth analysis.
- Performance Benchmarks: Compare your store’s performance over time or against industry benchmarks to gauge your competitiveness.
Based on 0 reviews
Be the first to review “Advanced WooCommerce Reporting”
Related products
-
-
-
E-Mail & Newsletters, Plugin
Popup Plugin for WordPress & Popup Editor – Master Popups for Email Subscription
 E-Mail & Newsletters, Plugin
Popup Plugin for WordPress & Popup Editor – Master Popups for Email Subscription
- Free & Original product!
- You will be given files that remain unaltered and unedited
- 100% Clean Files & Free From Virus
- Unlimited Domain Usage
- Free New Version
- Product Version : 3.8.7
- Product Last Updated : 14.12.2022
- License : GPL
SKU: n/a -
Plugin, woo commerce
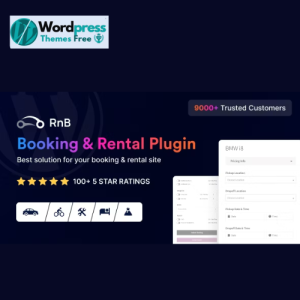
RnB – WooCommerce Bookings & Rental Plugin
Free & Original product!
You will be given files that remain unaltered and unedited
100% Clean Files & Free From Virus
Unlimited Domain Usage
Free New Version
Product Version: 14.0.8
Product Last Updated: 01.08.2023
License: GPLSKU: n/a -


There are no reviews yet.